According to a Congressional Research Service report, “U.S. Energy: Overview and Key Statistics,” in 2010 renewable sources contributed 8 quadrillion BTUs of energy, which constitutes 11% of U.S. production and 8.2% of consumption.
The report brings together a wide range of governmental statistics on renewable energy production and consumption. Sources include the “Monthly Energy Review” (PDF, updated in 2012), from the Department of Energy, and “Annual Energy Review” (PDF, updated in 2011), from the Energy Information Administration.
The findings cover production and consumption of renewables, with breakdowns of for industrial and consumer use.
- In 2010 the total U.S. energy consumption was 98 quadrillion BTUs; of this, 75 quadrillion BTUs (77%) was generated domestically and the balance (23%) imported. Renewable sources contributed 8 quadrillion BTUs, which constitutes 11% of production and 8.2% of consumption. By 2011, renewables’ contribution rose to 9% of consumption.
- Hydropower was the largest source of renewable energy, generating 31% of the 2010 total. Wood was next, generating 25% of the total, followed by biofuels (23%), wind (11%), waste (6%), geothermal (3%) and solar/PV (1%).
- Hydropower generated 2.5 quadrillion BTUs of energy in 2010, little changed since 1970. At the time, hydropower constituted 65% of all renewable energy, but as the contribution from other renewables has grown, hydropower’s share has dropped to 31%.
- Biofuels such as ethanol and biodiesel generated 2.0 quadrillion BTUs of energy in 2010. U.S. consumption of fuel ethanol in 2011 was approximately 14.0 billion gallons, 10.2% of the approximately 136 billion gallons of gasoline consumed.
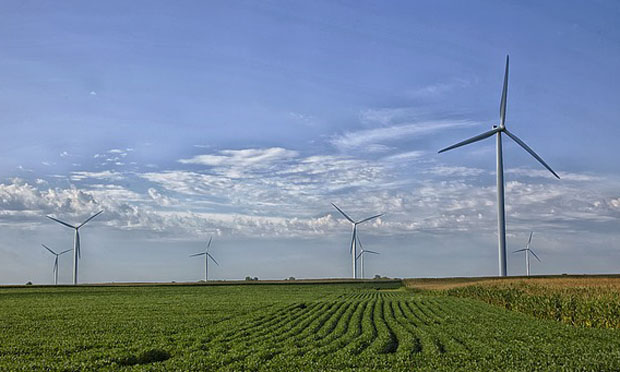
- Wind generated 924 trillion BTUs of energy in 2010. Production changed little from 1989 to 1998, reaching only 31 trillion BTUs. From there it rose sharply, increasing from 70 trillion BTUs in 2001 to 142 in 2004 and 341 in 2007. The total in 2010 is estimated to be 924 trillion BTUs, and the potential is significantly higher.
- Wind is the fastest-growing source of electrical generation in the United States. From 1999 to 2002, natural gas added 132 gigawatts of capacity while wind added 2.7, a ratio of 1 to 48. From 2003 to 2010, natural gas added only 93.6 gigawatts of new capacity (a 29% decline over the previous period’s additions), while wind added 33.2 gigawatts (a 1,130% increase), a ratio of 1 to 2.8.
- Geothermal contributed 212 trillion BTUs of energy in 2010, more than double the figure in 1985, 97 trillion BTUs.
- From 1990 to 2005, solar energy increased only modestly, from 59 to 63 trillion BTUs. It began to increase significantly in 2006, rising to 98 trillion BTUs by 2009 and 109 trillion BTUs by 2011.
For an overview and detailed information on energy in the United States, see “U.S. Energy: Overview and Key Statistics”; “Electrical Generation and Consumption in the United States”; and “Petroleum and Its Role in the U.S. Economy.”
A related resource, the Energy Information Administration’s “Annual Energy Outlook 2011,” projects energy trends out to 2035.
Keywords: renewable energy, wind power
