China’s economy is the second-largest in the world, after that of the United States, but its GDP is rising fast — up 12.4% in dollar terms in 2013. For most nations that would be a stellar year — the United States managed 3.2% in the fourth quarter of last year — but China had registered 18% or more every year from 2006 to 2011.
As is often the case, the growth in household income hasn’t been uniformly distributed. The country’s poorer residents have benefited: “We can reasonably expect the virtual elimination of extreme poverty [in China] by 2022,” the World Bank reported in 2013. But a survey by Peking University the same year found that the top 5% of the country’s households took home 23% of the total household income in 2012, while the bottom 5% earned just 0.1%. China’s income inequality started rising when the country’s former leader Deng Xiaoping launched market-oriented reforms and opened the economy in 1978. Deng once said in an interview, “We permit some people and some regions to become prosperous first, for the purpose of achieving common prosperity faster.”
The incomes of the poor are growing, but it appears the rich are getting richer much faster: Between 2002 and 2007, the income ratio of the country’s richest 10% and the poorest 10% increased from 19:1 to 25:1, according to the World Bank. Driving the phenomenon are development policies that favor heavy industry, cities and special economic zones in coastal areas. In 2009, urban residents earned 2.33 times more than those in rural areas, while the income of rural residents in coastal provinces tripled from 1989 to 2004.
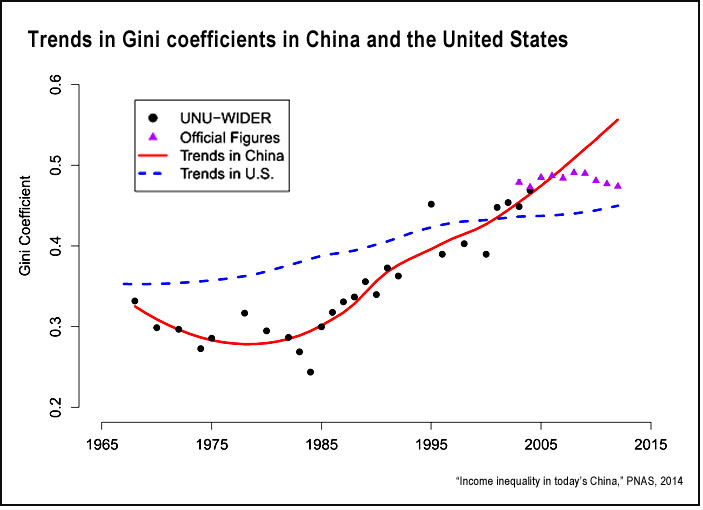
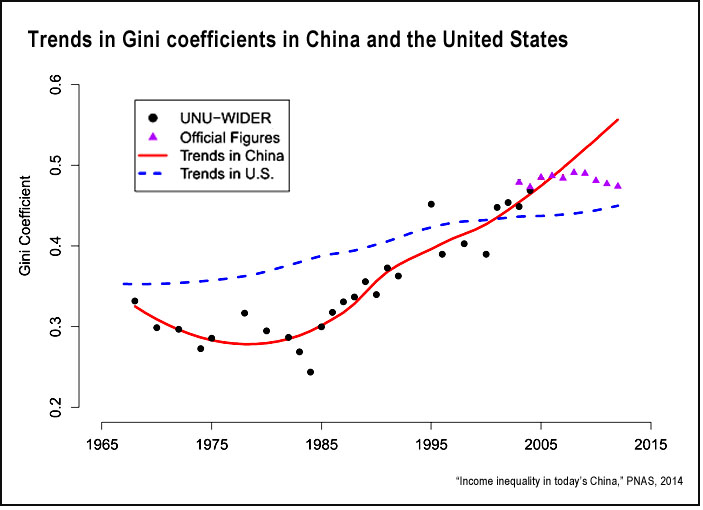
The most commonly used measure of income inequality, the Gini coefficient, ranges from 0, which indicates perfect equality, to 1, as maximal inequality; a coefficient of 0.4 or higher is widely regarded as an indication of severe inequality in a society. After China’s official Gini coefficient reached 0.412 in 2000, its National Bureau of Statistics (NBS) stopped releasing the data, saying “income data for wealthy households was incomplete.” But a couple of months after a Chinese university reported China’s Gini coefficient reached 0.61 in 2012, the NBS started releasing the coefficients again. According to the NBS chief, “China’s Gini coefficient stood at 0.474 in 2012, down from a peak of 0.491 in 2008.” That’s slightly lower than America’s Gini coefficient of 0.477.
A 2014 study published in the U.S. Proceedings of the National Academy of Sciences, “Income Inequality in Today’s China,” used several newly available surveys, including a large-scale NBS survey and six independent surveys conducted by university-affiliated organizations, to estimate China’s Gini coefficients for recent years and compare them with those in the U.S. The researchers, Yu Xie of the University of Michigan and Xiang Zhou of Peking University, closely examined the factors that contributed to the income inequality in both countries.
The study’s findings include:
- Since the 1980s, income inequality in China has risen at a faster pace than in the United States. From 1980 to 2012, China’s Gini coefficient increased from 0.30 to 0.55, surpassing the U.S. coefficient of 0.45.
- Regional disparities are significantly higher in China than they are in the United States: Variations across Chinese provinces account for about 12% of the country’s overall income inequality, while differences among states contribute to less than 2% of U.S. inequality.
- More than 10% of China’s total inequality is attributed to the rural-urban gap, which makes little contribution to inequality in the United States.
- Family structure in the United States accounts for 12% of the country’s total inequality, but accounts for only 2% of the inequality in China. This is in part because 7.9% of the U.S. population is in a single-parent family structure, compared with only 1.9% of the Chinese population.
- The family head’s race/ethnicity contributes more to total inequality in the United States than in China.
- In both countries, the education level of the head of the household accounts for about 15% of the total inequality.
- High income inequality in China is not strictly a recent phenomenon: “In 1980, the Gini coefficient in urban China was as low as 0.16, but the nationwide Gini coefficient was around 0.3, higher than other socialist economies at that time. From a comparative perspective, other large developing or middle-income countries, such as Brazil, India and Indonesia, also exhibit similar patterns of large regional income disparities. For example, about 14–15% of the total inequality in Brazil is attributable to regional differences.”
“Our results reveal that China’s income inequality has grown rapidly in the last three decades, to a very high level around 2010,” the researchers conclude. “The rapid rise in income inequality can be partly attributed to long-standing government development policies that effectively favor urban residents over rural residents and favor coastal, more developed regions over inland, less developed regions.” To address this problem, they suggest that government policies should work to reduce rural-urban and regional disparities.
Related research: A 2014 paper in the Quarterly Journal of Economics, “Capital Is Back: Wealth-income Ratios in Rich Countries, 1700-2010,” looks at the rising wealth-income ratios in the top eight developed countries from 1970 to 2010 and studies the impacts of wealth inequality. Among its findings is that wealth-income ratios have been rising in each of the top eight developed countries over the past four decades, from 200% to 300% in 1970 to 400% to 600% in 2010: “In effect, today’s ratios appear to be returning to the high values observed in Europe in the 18th and 19th centuries (600% to 700%).”
Keywords: inequality, Gini coefficient, China, Asia

