The question of how the government can alleviate poverty has long been disputed in the United States. In a 1986 radio address, President Ronald Reagan urged that the welfare system set up to help the poor was itself to blame for their plight. “We spend vast amounts on a system that perpetuates poverty,” he said. Ten years later, President Bill Clinton signed a bill “ending welfare as we know it,” abolishing the federal Aid to Families with Dependent Children and shifting control of welfare programs to the states. The bill required recipients of benefits to work and limited aid to five years.
Critics of anti-poverty programs point out that significant progress has not been made in eliminating poverty in recent decades. Indeed, the overall poverty rate has hovered around 12% to 15% since the 1970s. Without a doubt, poverty and inequality continue to be significant problems in the United States, and the 2007-2008 recession led to levels of hardship not seen since the Great Depression. But how one defines and thus measures “poverty” is also central to the debate over anti-poverty programs and their effectiveness. The Census Bureau’s Official Poverty Measure is based on metrics that are little changed from the 1960s, and it has been criticized for using outdated poverty thresholds and neglecting government policies that include non-cash transfers. In response, the U.S. Census Bureau in 2011 began formally experimenting with a new poverty paradigm, the Supplemental Poverty Measure (SPM).
A 2014 study for the National Bureau of Economic Research, “Waging War on Poverty: Historical Trends in Poverty Using the Supplemental Poverty Measure,” focuses on the effectiveness of government anti-poverty policies since 1967, using the new measure. The scholars — Liana Fox from the Swedish Institute for Social Research and Irwin Garfinkel, Neeraj Kaushal, Jane Waldfogel and Christopher Wimer of Columbia University — use data from the Annual Social and Economic Supplement, the Current Population Survey and the Consumer Expenditure Survey in order to construct the Supplemental Poverty Measure for the years 1967 to 2012. They then use the measures to estimate what poverty rates would have been had certain government policies not been enacted.
The key findings cited in the study include:
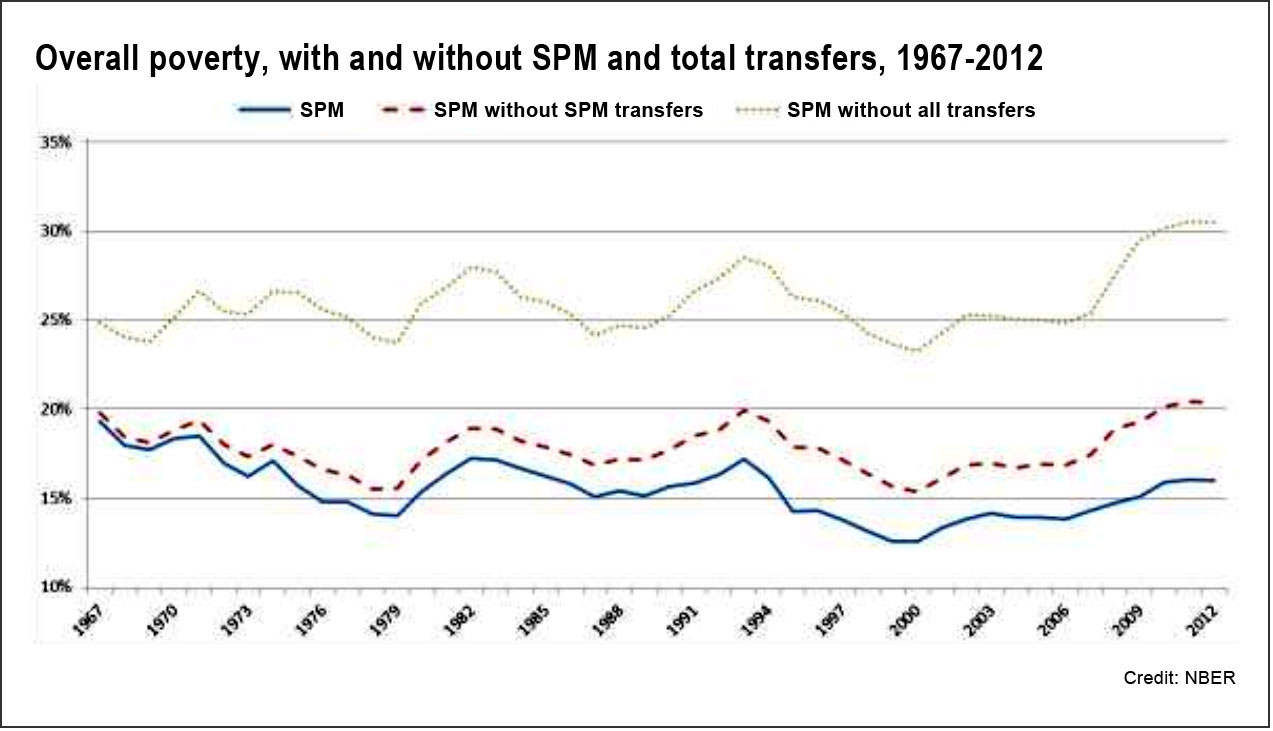
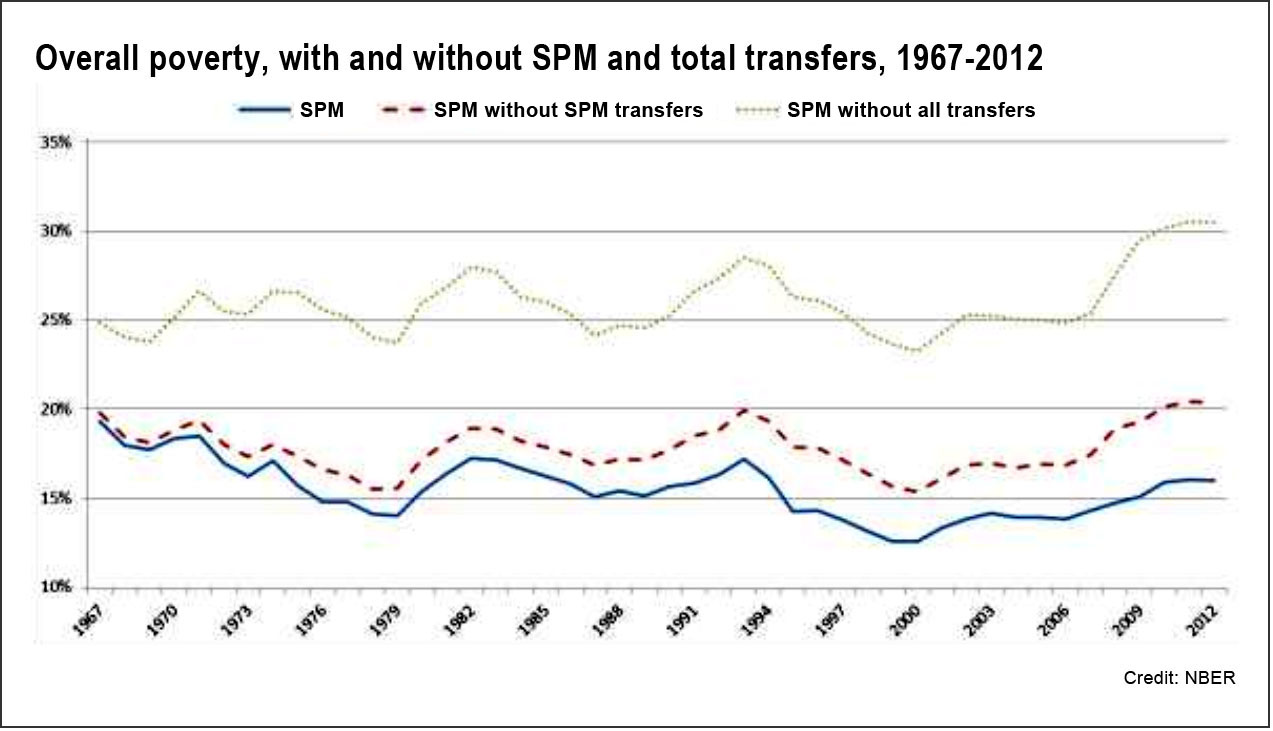
- Based on the Supplemental Poverty Measure, government programs were more effective in reducing poverty than previous estimates suggested. Whereas the Official Poverty Rate showed almost no reduction in poverty between 1967 and 2012, “estimates using SPM show that without government programs, poverty would have risen from 25% to 31%, while with government benefits poverty has fallen from 19% to 16%. Thus government programs today are cutting poverty nearly in half (from 31% to 16%) while in 1967 they cut poverty by only a quarter (from 25% to 19%).”
- Since the Official Poverty Measure does not take into account non-cash transfers, the measure underestimates the important role that government programs play in alleviating child poverty. “Taken together, government programs in 2012 reduced child poverty by 12 percentage points, and deep child poverty by 11 percentage points, versus 3 and 5 percentage points respectively in 1967.”
- Government anti-poverty programs have been important in attenuating the impact of economic downturns like the Great Recession. “Without government programs, deep child poverty rates would be as high as 20% during economic downturns, as opposed to the 4% to 6% rates we observe with government programs.”
- Tax credits and food and nutrition programs have been especially effective in reducing poverty. Among all transfers, the impact of food and nutrition programs has been the largest in the last few years. The Official Poverty Measure misses this effect since it only takes into account cash transfers.
The authors note that one limitation of the study is that the estimated poverty rates do not take into account potential behavioral responses to the programs. They also point to the problem of under-reporting of benefits in the data used to calculate the measures. The authors conclude: “Although our estimates are informative, much remains to be done. As mentioned, we hope to augment the data presented here with data from 1959, prior to the War on Poverty.”
Related research: A paper from Stanford University, “State of the Union: The Poverty and Inequality Report 2014,” synthesizes economic data and academic research to paint a full picture — a “unified analysis” — of key indicators of the nation’s economic health that may not receive the same visibility as GDP, aggregate growth patterns or stock market trends. It finds that the U.S. economy is not delivering enough jobs, and the labor market appears to be failing by the best available measure: “Six years after the start of the Great Recession, the proportion of all 25-54 year olds who hold jobs (i.e., ‘prime age employment’) was almost 5% lower than it was in December 2007, both for men and women alike.”
Keywords: poverty, economy, financial crisis

